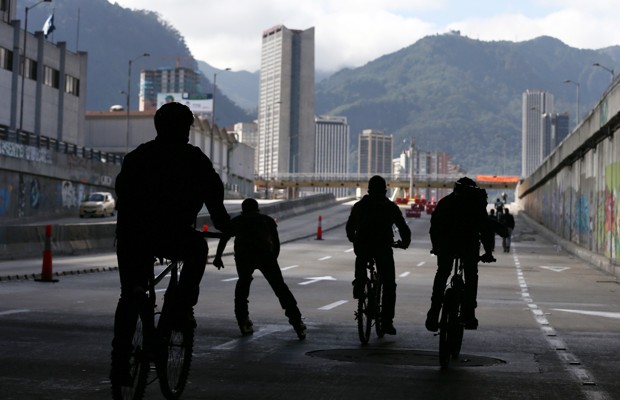
(Today Colombia via Citylab) They say money can’t buy happiness, but it can definitely purchase some of the basic ingredients. Take, for example, a livable commute: In many cities, those at the lower rungs of the income ladder tend to lack access to the neighborhoods and transportation options that make for saner trips to work. Longer commutes eat away at hours spent sleeping and being with family—key coefficients in the happiness equation. Charted across the space of a city, the workday rhythms of the rich and poor can reveal two very different worlds.
That’s the portrait that emerges of commuters in Colombia just published in Royal Society Open Science. Using recent citywide mobility survey data, a team of Colombian and Spanish transportation engineers plotted commute patterns in the cities of Medellín and Manizales according to residents’ class. (Colombian law actually assigns all households to one of six socioeconomic strata, based on their income, home value, and family size, and other factors.) The researchers looked at the geographic distribution of the start and end points of workers’ commutes, as well as the times of day at which they made those trips and the modes of transportation used.
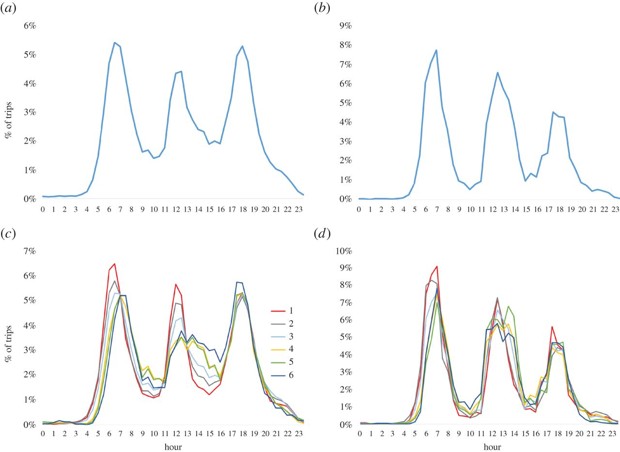
Percentage of trips as a function of time during a week day. Time is discretized in intervals of 30 min. Left panels (a) and (c) correspond to the city of Medellín, while right panels (b) and (d) correspond to Manizales. Lower panels show separately this percentage for each socio-economic class, and upper panels do that for the whole population. (Royal Society Open Science)
Their findings are striking. Commute cycles barely overlap at the highest and lowest ends of the wealth ladder. Trips made by workers in class 6—the very richest strata—are highly localized and redundant, meaning that lots of travelers in that class cover much of the same areas. By contrast, the poorest workers in class 1 are flung all across the city and use a variety of different routes. As wealth increases, commuters cover less ground as their travel patterns become more concentrated. The researchers also found that commuting time decreases as socioeconomic class increases, due not only to smaller distances but also more efficient modes of transportation.
Depending on their class, workers also travel at different times of day. For classes 1 and 2, the onset for their early morning peak commute times occurs around 5 to 6 AM, while for class 6 it doesn’t hit until 7 AM. Richer workers, in other words, may sleep in a later. Differences in afternoon peak commute times—in Medellín in particular—are also apparent: For class 1, there’s another clear peak around 12 PM. As wealth increases, afternoon peak times become more spread out.
Geographical location of origin (out, (a–c)) and destination (in, (d–f)) nodes of the trips performed during each time slot (AM left, MD middle, PM right) by the individuals of three socio-economic classes, namely 1 (poorest, red squares), 3 (low middle class, light blue circles) and 6 (richest, dark blue triangles). (Royal Society Open Science)
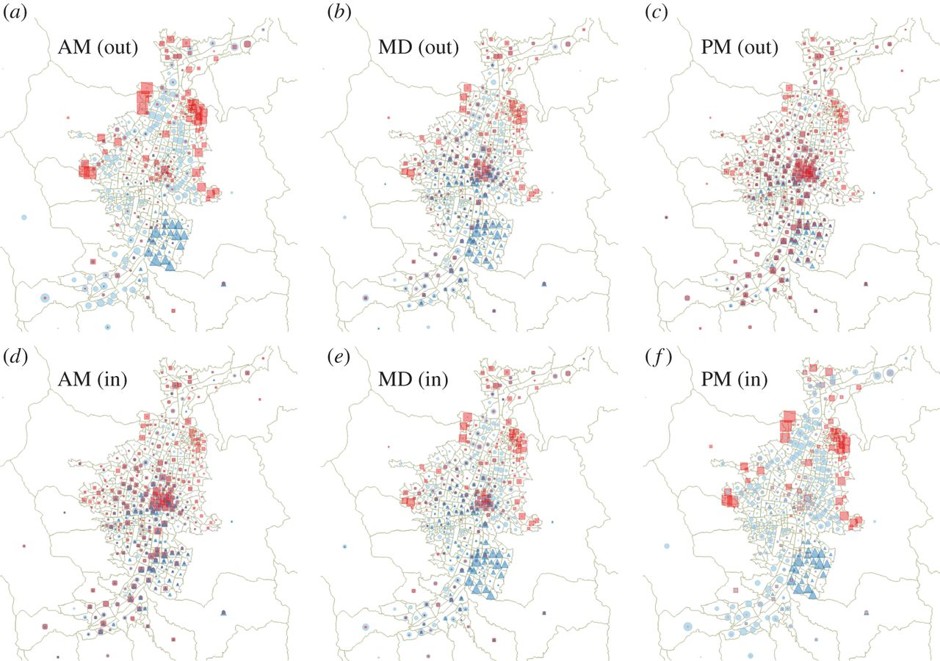
Above, six maps of Medellín commutes put some of these cross-cutting findings into geographic context, with the socioeconomic data divided into three groups. The poorest tier is represented by red circles, the middle in light blue circles, and richest in dark blue triangles. (The size of these symbols corresponds to the share of the corresponding class that’s taking trips from that location.) The researchers plotted the movements of these groups spatially and between three periods of the day (roughly speaking: morning, noon, and night). The top row of maps shows starting points and the bottom shows destinations. It’s clear how much further, and what a plethora of routes, the poorest classes have to take to get to their jobs, even though those jobs appear to be clustered in the center city. By contrast, the richest residents move shorter distances from a few pockets of the city to the center.
Colombia’s income inequality is some of the worst in the world, but class disparities in commuting (and the negative health effects of the sleep gap that can accompany these disparities) persist globally. In the U.S., for example, black Americans tend to sleep less deeply over fewer hours than do their white counterparts, which can lead to major long-term health consequences, including early death. It’s not entirely understood why, but several work-related factors are likely to be involved. African American workers (especially women) are more prone to juggle multiple jobs with shifting schedules, work less desirable overnight positions, and get to jobs via time-consuming public transportation, as Americans of color are statistically less likely to own a car. All of this can have serious impacts on sleep duration and quality.
To keep up financially, let alone get ahead, low-income workers often begin their days at a disadvantage—and they might enjoy fewer hours of sleep before they have to start all over again.
Original article published at Citylab.com
